

How to Measure True Marketing Profit by Channel
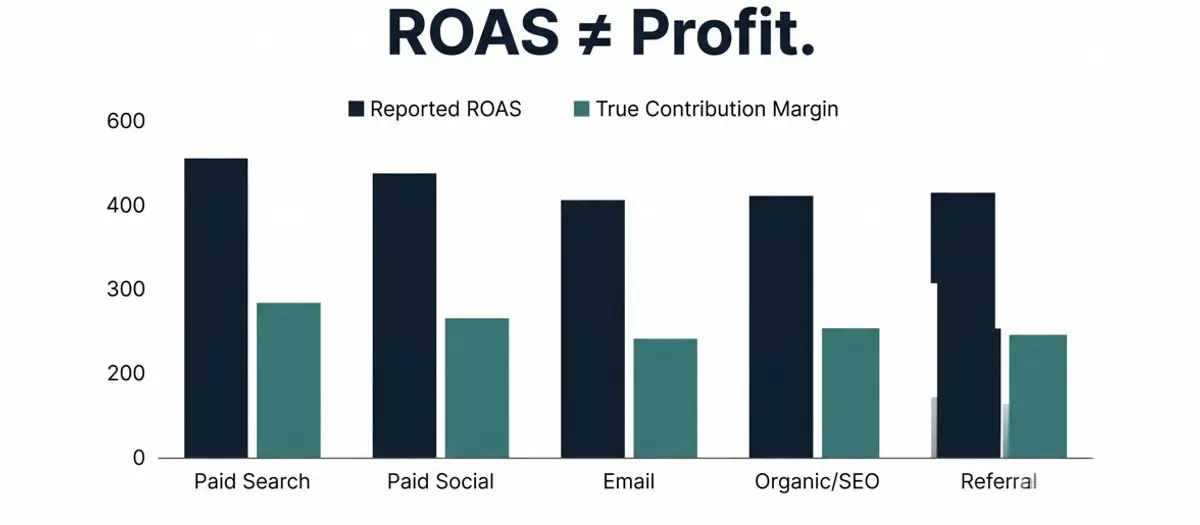
Reported ROAS and true contribution margin are not the same number. Across every channel, the gap between what platforms claim and what actually hits your P&L is where growth decisions go wrong.
Most marketing teams can tell you their ROAS. Very few can tell you their profit.
That gap — between what looks like performance and what actually hits the P&L — is where growth stalls, budgets get misallocated, and scaling decisions go sideways. Fixing it starts with measuring the right thing.
Why ROAS Is the Wrong Finish Line
ROAS measures revenue returned per ad dollar. It does not account for product cost, fulfillment, payment processing, returns, or the overhead sitting behind every transaction. A 4x ROAS on a product with 20% gross margins is not a win — it is a slow bleed.
The question is not "how much revenue did this channel drive?" The question is "how much contribution margin did this channel generate after we account for everything it actually cost?"
The Contribution Margin Framework
Contribution margin is revenue minus variable costs — everything that moves with each incremental unit sold. For a direct-to-consumer brand, that means:
- Cost of goods sold (COGS)
- Fulfillment and shipping
- Payment processing fees
- Returns and refunds
- Channel-specific media spend
What is left after those subtractions is your true contribution per order. That is the number you should be optimizing toward — not revenue, not ROAS.
Fully-Loaded CAC: The Other Half of the Equation
The contribution margin calculation tells you unit economics. But sustainable growth requires something more: understanding what it actually costs to acquire a customer — fully loaded.
Most brands calculate CAC as media spend divided by new customers. That is a start. But it misses agency fees, creative production costs, attribution tooling, and the internal headcount managing those campaigns. Add those in and your CAC number typically rises 30–60%.
Fully-loaded CAC benchmarked against cohort LTV — not blended, not average, but actual cohort LTV by acquisition channel — is the ratio that tells you whether you have a profitable growth engine or an expensive customer rental program.
Building Channel-Level Profit Views
Most teams look at channel performance in their ad platforms. But ad platforms have a fundamental conflict of interest: they are optimized to show you metrics that justify more spend, not metrics that reflect your actual profitability.
Building a true channel-level profit view requires connecting three data sources:
- Ad platform spend data (broken down by channel and campaign)
- Order-level data from your commerce platform (revenue, SKU, discounts applied)
- Finance data (COGS by SKU, fulfillment rates, payment processing fees, return rates)
When those three sources are joined at the order level — not blended or averaged — you can calculate contribution margin per acquisition channel. That is when the picture gets interesting.
What the Data Usually Reveals
The pattern we see repeatedly: the channel with the highest ROAS is rarely the channel with the highest contribution margin per order. Why? Because high-ROAS channels often drive lower-AOV transactions, skew toward heavily discounted SKUs, or attract customers with high return rates.
Meanwhile, a channel posting a modest 2.5x ROAS on premium products with strong retention might be generating 3x the contribution margin of your "top" performer.
You cannot see that without channel-level profit data. You can only see it when you stop optimizing for the metric that ad platforms want you to optimize for.
The Capital Allocation Loop
Once you have accurate channel-level contribution margin data, you can run what we call the Capital Allocation Loop: a systematic process for shifting budget from low-margin channels to high-margin channels — not based on gut instinct or platform recommendations, but based on actual profit data.
The loop runs quarterly. You measure contribution margin by channel. You identify the outliers in both directions. You shift capital accordingly. Then you measure again.
It sounds simple because it is simple — in concept. The complexity is in the measurement infrastructure required to run it accurately. Most brands are not there yet. The ones that are tend to grow faster and more profitably than their peers.
Start Here: The Four Numbers You Need This Week
You do not need to rebuild your entire data stack to start measuring marketing profit. You need four numbers, by channel:
- Gross revenue generated
- Average gross margin % (use your blended rate if you do not have SKU-level data yet)
- Total media spend (including agency fees if possible)
- Estimated fulfillment cost per order
Run those numbers. You will quickly see which channels are generating real margin and which are buying revenue at a loss. That is your starting point.
Measurement precision can come later. The directional insight — which channels are actually profitable — is available right now. Go get it.
—
David Manela is the founder of Exactius, a performance marketing firm that builds revenue-accountable growth systems for high-growth brands.
David Manela
David Manela is the founder of Exactius and creator of the Growth Operating System — a framework for deploying capital-efficient, compounding growth inside scaling companies.
FAQ
Frequently asked
What is the difference between ROAS and marketing profit?
ROAS measures revenue returned per ad dollar spent. Marketing profit — or contribution margin — accounts for all variable costs including COGS, fulfillment, payment processing, returns, and media spend. A channel can have strong ROAS while still generating negative contribution margin if variable costs are high.
How do I calculate contribution margin by channel?
Contribution margin by channel = (Revenue from channel) - (COGS) - (Fulfillment costs) - (Payment processing fees) - (Returns) - (Media spend for that channel). You need to join ad platform data, commerce platform order data, and finance data at the order level to calculate this accurately.
What is fully-loaded CAC?
Fully-loaded CAC includes all costs associated with acquiring a customer — not just media spend. This means adding agency fees, creative production costs, attribution tooling subscriptions, and the proportional cost of internal headcount managing those campaigns. Fully-loaded CAC is typically 30–60% higher than media-only CAC.
Which channels typically have the highest contribution margin?
It varies significantly by business model, product margins, and customer behavior. The key insight is that the channel with the highest ROAS is frequently not the channel with the highest contribution margin. Channels driving high-AOV transactions on premium products with low return rates often outperform on contribution margin even with lower ROAS.
How often should I review channel-level profitability?
At minimum, quarterly — which aligns with budget planning cycles and gives enough time for trends to emerge. Best-in-class operators review contribution margin by channel monthly and use that data to run a Capital Allocation Loop, systematically shifting budget toward higher-margin channels each cycle.
Related Reading
Keep going



Ready to fix the system?
Your growth system is either compounding or degrading.
Book a diagnostic call. We'll identify where your growth system is breaking and what it's costing you.