

CAC Payback Period Benchmarks by Stage
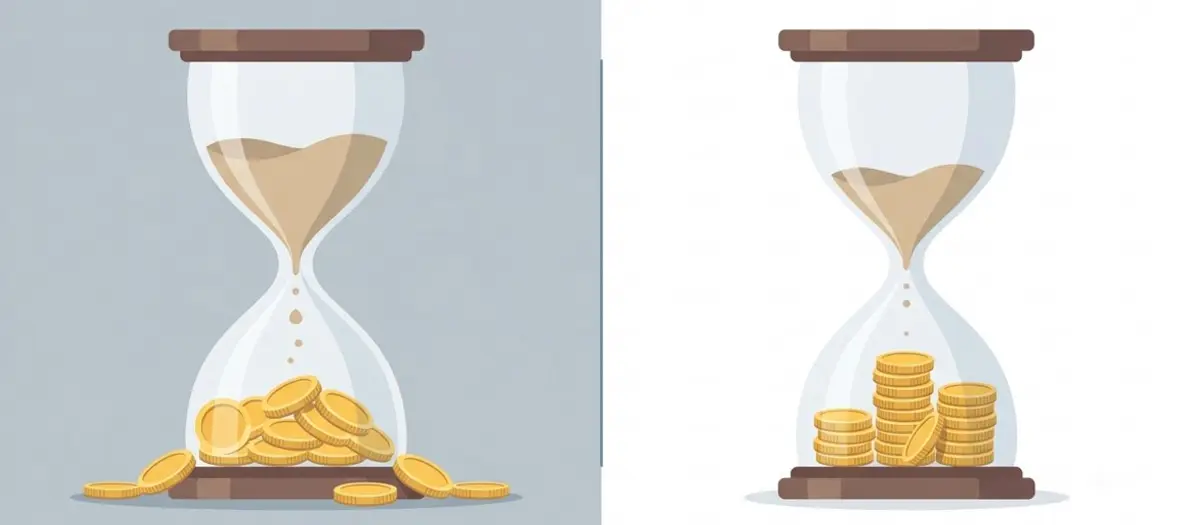
A shorter payback period means carrying acquisition costs for fewer months before they are recovered.
CAC payback period is one of the clearest signals of capital efficiency in a growth business. It tells you how many months it takes to recover what you spent to acquire a customer, and it is a standard metric in investor benchmark surveys such as the annual KeyBanc Capital Markets and Sapphire Ventures survey of private SaaS companies.
The challenge is that there is no universal benchmark. What counts as a healthy payback period depends heavily on your stage, your business model, and whether you are measuring it correctly. A 24-month payback period can be acceptable for an enterprise SaaS company with low churn and expanding accounts, and a disaster for a DTC brand with limited repeat purchase behavior.
This article covers how to calculate CAC payback period correctly, what published medians and top-quartile figures show at each stage, and why holding payback short matters more as a company scales.
How to Calculate CAC Payback Period (Correctly)
The standard formula: CAC ÷ Monthly Gross Margin per Customer. As an illustration, if it costs $600 to acquire a customer who generates $100 per month in gross margin, your payback period is 6 months.
Two inputs are easy to get wrong:
1. Using media-only CAC instead of fully-loaded CAC.
Fully-loaded CAC includes media spend, outside partner or internal team costs, creative production, tooling, and any referral or discount incentives. Media-only CAC counts just the ad spend, so it understates true acquisition cost, and the size of the gap depends on your cost structure. Payback period calculated on media-only CAC is not a real number.
2. Using revenue instead of gross margin contribution.
Payback period should reflect how long it takes to recover acquisition cost from the margin a customer generates, not from revenue. For example, a business with a 60% gross margin and $100 in monthly revenue per customer contributes $60 a month toward CAC recovery, not $100. The OpenView and KeyBanc benchmarks cited below are both calculated on gross margin.
Benchmarks by Stage: SaaS Companies
Public payback benchmarks such as OpenView's and KeyBanc's come from surveys of private SaaS companies, and they segment companies by annual recurring revenue (ARR) rather than by funding round. The ARR bands below are the closest public proxy for stage, and they describe SaaS companies, not every business model. Two patterns stand out in OpenView's data: the median payback gets longer as companies scale, and the top quartile stays well below the median in every band. That gap is the case for payback discipline. The targets below are the top-quartile marks, which is what disciplined operators aim for.
Early stage (under $5M ARR): aim for the top-quartile mark of 5 months.
OpenView's 2023 SaaS Benchmarks Report, which defines payback as the months of subscription gross margin needed to recover fully-loaded CAC, found a median of 8 months for companies under $1M in ARR and 11 months for companies between $1M and $5M, with the top quartile at 5 months in both bands. Early figures rest on small customer bases, so the trajectory matters as much as the number. Investors look for evidence that the unit economics can hold up at scale: gross margin expansion potential, contraction in CAC as the brand builds, and churn rates that suggest genuine product value.
Scaling ($5M to $20M ARR): aim for 8 months, not the 14-month median.
In the same OpenView data, SaaS companies between $5M and $20M in ARR had a median payback of 14 months, while the top quartile recovered CAC in 8. Disciplined operators at this stage aim for the top-quartile mark. A payback closer to the median requires a strong offsetting narrative: very low churn, high net revenue retention (NRR), or a clear path to CAC compression.
Later stage (above $20M ARR): hold the line as the median drifts longer.
Median payback gets longer as SaaS companies scale. OpenView's 2023 median was 22 months both for companies between $20M and $50M in ARR and for those above $50M, up from 17 and 16 months respectively in 2022. The top quartile in OpenView's $20M to $50M band was at 13 months, about 9 months faster than the median. Holding payback near that mark as spend grows puts a later-stage company in the top quartile of its peers. For a market-wide reference point, the 2024 KeyBanc Capital Markets and Sapphire Ventures SaaS Survey estimated a fully-loaded median payback of 20 months for 2024 across all respondents, with top-quartile companies at 14 months.
Net revenue retention changes the math.
NRR is the main offset to a long payback. As an illustration, a company with 120% NRR can sustain a longer payback period than one with 100% NRR, because its existing revenue base grows without additional CAC. David Skok's SaaS metrics guide on For Entrepreneurs set a guideline of under 12 months in 2011, and it remains a demanding bar: Skok now notes that payback under 12 months is very rare in practice, and that enterprise businesses with land-and-expand models successfully run at around 20 months.
What Good Looks Like by Stage: DTC and E-Commerce Models
Public, stage-by-stage DTC payback benchmarks with a disclosed methodology are scarce, so this section covers principles rather than target numbers. DTC payback depends on repeat purchase behavior, which is less predictable than subscription revenue, and DTC gross margins are usually lower than software margins. A DTC brand with strong subscription or refill behavior has a fundamentally different profile than a one-time purchase brand.
Early stage: a clear repeat purchase thesis.
Early-stage DTC investors tend to focus on cohort behavior more than payback in isolation. If 60-day repurchase rates are strong and LTV curves are steepening, a longer payback can be defensible. If LTV is flat after the first purchase, a long payback is a structural problem, because the repeat purchase margin that would accelerate payback does not exist.
Series A: blended payback and channel mix.
By Series A, the question is whether blended payback holds up as spend grows. Brands with a long payback at this stage often have a channel mix problem: they are over-indexed on expensive acquisition channels without retention programs that shorten the recovery curve.
Series B: margin and retention.
By Series B, healthy unit economics mean contribution margin per order is strong enough, and repeat purchase rates high enough, that CAC is recovered early in a customer's life. A brand that still has a long payback at this stage typically has a gross margin or retention problem to fix before additional capital deployment will improve outcomes.
Series C and beyond: fast recovery at scale.
The best-performing DTC brands at growth equity stages recover acquisition cost quickly enough that marketing spend can be deployed at scale with confidence. Brands that reach this point have usually solved two things at once: gross margin expansion through scale and supplier leverage, and retention programs (subscription, loyalty, replenishment) that pull forward the margin recovery curve.
Benchmarks by Customer Segment: B2B and Enterprise SaaS
B2B payback depends heavily on who you sell to. Longer sales cycles push CAC up, but contract values are higher, churn is typically lower, and NRR and expansion revenue are stronger offsets. Bessemer Venture Partners' 2021 guidance for cloud companies scaling to $100M in ARR sets payback targets by customer segment rather than by stage.
SMB and mid-market: under 12 and under 18 months.
Bessemer's targets are under 12 months for SaaS companies selling to small businesses and under 18 months for those selling to mid-market customers. Bessemer ties the difference to contract values and churn patterns, which vary by segment.
Enterprise: under 24 months.
For enterprise SaaS, Bessemer's target is under 24 months. Long sales cycles and high SDR and AE costs push CAC up, so investors weigh payback alongside the ratio of LTV to CAC, because the tail of revenue in a retained enterprise account can be very long. As an illustration, a 30-month payback on a customer that renews for 10 years at expanding contract values can still be a sound model. Over time, investors expect CAC to come down as the brand builds, marketing channels mature, and product-led growth or channel partnerships reduce dependence on outbound sales.
What Moves Payback Period, and What You Can Actually Control
Payback period is a function of three levers: CAC (the numerator), gross margin per customer (the denominator), and repeat purchase or expansion behavior (which effectively increases the denominator over time).
Reducing CAC is one lever, and often not the highest-leverage one. As an illustration of the arithmetic, a 20% cut in CAC shortens payback by 20%, and so does a 25% increase in gross margin per customer. For some DTC brands, gross margin improvement through price architecture or product mix is a faster path to a shorter payback than media efficiency gains.
The third lever, increasing the effective monthly margin contribution through retention, is easy to overlook. For example, a hypothetical DTC brand that converts 30% of first-time buyers to subscription in month 2 has very different payback dynamics than one that does not, even with identical CAC and order economics. This is why payback period and retention strategy cannot be managed separately.
The Payback Period Number Investors Actually Use
A company-wide blended payback period hides more than it shows. The more useful view breaks it out by acquisition channel, customer segment, and cohort vintage. As an illustration, a blended 12-month payback that masks a 6-month payback for organic customers and a 24-month payback for paid social customers tells a very different story than a flat 12 months across all channels.
The question that matters for capital allocation is where the next dollar of marketing spend is most efficiently deployed. A blended number does not answer that. Channel-level and segment-level payback period data does.
If you cannot produce payback period data by acquisition channel, you cannot answer the capital allocation question with rigor, and you are likely misallocating some portion of your marketing budget.
Sources
- OpenView Partners, 2023 SaaS Benchmarks Report: CAC payback by ARR band (archived PDF)
- KeyBanc Capital Markets and Sapphire Ventures, 2024 SaaS Survey (15th annual)
- Bessemer Venture Partners, Scaling to $100 Million (2021)
- David Skok, For Entrepreneurs: SaaS Metrics 2.0, detailed definitions
David Manela is the founder and CEO of Exactius, a full-funnel growth agency accountable for its clients' P&L.
Exactius is a full-funnel growth agency accountable for its clients' P&L. Its AI-enabled senior operators provide performance marketing, strategy, creative, and whole-business analytics and data science, engaged one function at a time or as a full team. It serves consumer and B2B companies where paid marketing is a main growth lever, through two practices: one for companies from $5M to $100M and one for companies from $100M to $1B.
David Manela
David Manela is the founder of Exactius and creator of the Growth Operating System — a framework for deploying capital-efficient, compounding growth inside scaling companies.
FAQ
Frequently asked
What is a good CAC payback period?
It depends on your business model and scale, and the published SaaS data shows median payback getting longer as companies grow. OpenView's 2023 SaaS Benchmarks Report found medians of 8 months under $1M in ARR, 14 months between $5M and $20M, and 22 months above $20M. Its top-quartile figures were 5 months under $1M, 8 months between $5M and $20M, and 13 months between $20M and $50M, and those are the marks disciplined SaaS operators aim for. Bessemer Venture Partners' 2021 targets by customer segment are under 12 months for SMB, under 18 months for mid-market, and under 24 months for enterprise SaaS. Public DTC benchmarks with a disclosed methodology are scarce, so DTC payback is best judged against cohort repeat purchase behavior and contribution margin. In all cases, calculate payback on fully-loaded CAC and gross margin contribution, not media spend and revenue.
How do you calculate CAC payback period?
CAC payback period = Fully-Loaded CAC ÷ Monthly Gross Margin per Customer. Fully-loaded CAC includes all costs to acquire the customer: media spend, agency fees, internal team costs, creative production, tooling, and any referral or discount incentives. Monthly gross margin is average revenue per customer multiplied by your gross margin percentage. Using media-only CAC or revenue instead of gross margin will produce a payback period that understates the true recovery timeline.
Why does CAC payback period matter to investors?
CAC payback period is a direct measure of capital efficiency. A shorter payback period means each dollar deployed in customer acquisition returns to the business faster, which reduces cash burn, lowers dilution requirements, and makes it possible to scale marketing spend without proportional equity raises. Investors use it to assess whether growth is being purchased at a price the model can sustain, and to compare capital efficiency across portfolio companies and market benchmarks.
What is the difference between CAC payback period and LTV:CAC ratio?
LTV:CAC ratio measures the total lifetime return relative to acquisition cost. It is a long-horizon metric that captures the full economic value of a customer relationship. CAC payback period is a short-horizon metric that tells you how quickly the acquisition investment is recovered. Both matter: LTV:CAC tells you whether a customer relationship is ultimately valuable; payback period tells you how long you are carrying the cash cost before recovery. High-growth businesses need both metrics to manage cash flow and capital allocation simultaneously.
How can a company improve its CAC payback period?
Three levers drive payback period: reducing fully-loaded CAC, increasing gross margin per customer, and increasing monthly margin contribution through retention and repeat purchase behavior. CAC reduction is only one of them, and gross margin improvement and retention programs (subscription conversion, loyalty, replenishment) can compress payback periods faster. The highest-leverage approach is to disaggregate payback period by acquisition channel and customer segment, identify where it is already short, and concentrate capital there while working to improve the channels where recovery is slowest.
Is a 12-month CAC payback period good for DTC?
It depends on repeat purchase behavior and contribution margin, and public stage-by-stage DTC payback benchmarks with a disclosed methodology are scarce. A 12-month payback is easier to defend when cohorts show strong repeat purchase and steepening LTV curves, and harder to defend when LTV is flat after the first order. A 12-month DTC payback period that has been flat over multiple cohorts is a signal that the unit economics are not improving with scale, which deserves scrutiny at any stage above seed.
Related Reading
Keep going

Ready to fix the system?
Your growth system is either compounding or degrading.
Book a diagnostic call. We'll identify where your growth system is breaking and what it's costing you.